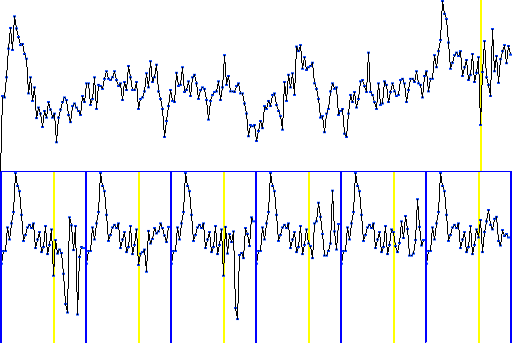
As you can see, the forecasts are different, yet build on the same data.
This is the unpredictability of the future. The laws of physics allow
many possible futures, and these are some likely ones.
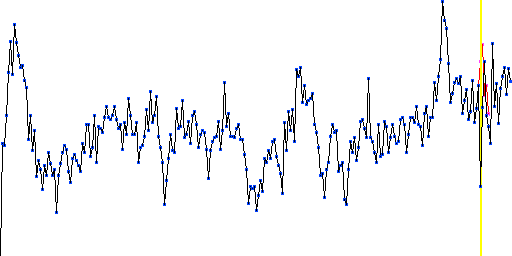
I got the temperature data at the beginning of September, and the calculations took about a month, so I presented them at the beginning of October.
My methods dig very deep to find patterns.
The
variability in the forecasts show that there are not much pattern to
find, in these data.
And this lack of patterns has been reported by many researchers of climate. They say it is close to a random walk. That it is chaotic. Generally fairly unpredictable. And their analyses seem quite sound to me.
So, I decided to test this for myself, using totally different methods for finding patterns.
And yes, there really are not much pattern at all. Quite similar to random walks.
You may contact me politely:
kim.oyhus@gmail.com