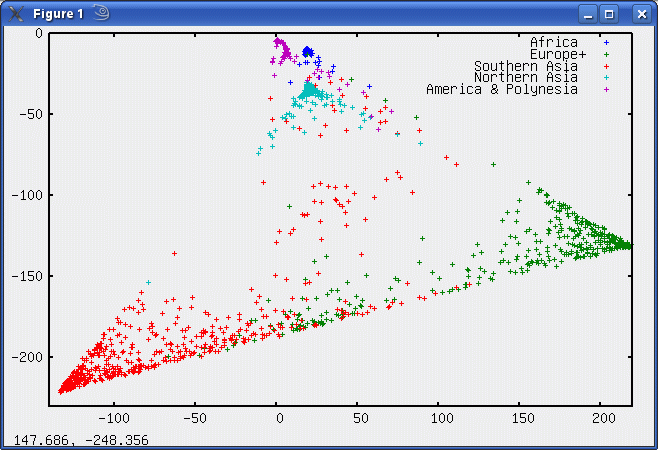
After having read an apparently endless mess of unfounded claims and politically "corrected" science about genetics and so called races, and noticing a lack of clear statistical illustrations, I decided to make such an illustration myself:

Europeans are at the right of the triangle, while the Indian subcontinent is at the bottom left. The top is shared with Asians, American Indians, Polynesians, and Africans. The largest dimension is horizontal.
The 3 clusters at the top are quite distant from each other in other dimensions, but not nearly as distant as Europeans and southern Asians, which make the bottom Indo-European line in this triangle. I strongly suspect that this horizontal distance is too large, while the distance between Africans and Asians is too small, and that this is because the data are pre-analyzed, or that Europeans and Indians are overrepresented. It would be even clearer in 3D, but displays are 2D. I have some ideas of how to show it in 3D.
If this explanaton of distinct groups interbreeding is correct, it would mean that the speed of human evolution can be faster, since humans now inhabit a much larger part of genetic space.
From the messy chaotic controversial stuff I read about this on the net and in the press, I got the impression that the endpoints should be quite diffuse and overlapping, but they are not. They are instead so sharp that defining races are easy, if one wants to call these clusters that. Perhaps subspecies is a better word. I do not know. I am not a biologist, but a physicist.
Anyway, what people call races in ordinary every day language, clearly exists.
The data itself was taken from the colourful column at the left of the page, gotten more directly from figure 2A of the original article and illustrations at: http://www.plosgenetics.org/article/slideshow.action?uri=info:doi/10.1371/journal.pgen.0020215#
The article itself is:
Low Levels of Genetic Divergence across Geographically and Linguistically Diverse Populations from India
by:
Noah A. Rosenberg1*, Saurabh Mahajan2, Catalina Gonzalez-Quevedo2,
Michael G. B. Blum1, Laura Nino-Rosales3, Vasiliki Ninis3, Parimal
Das3, Madhuri Hegde4¤, Laura Molinari4, Gladys Zapata4, James
L. Weber5, John W. Belmont4, Pragna I. Patel
One source of inaccuracy in my figure is that the original figure had just 7 colours, representing 7 clusters of hundreds of genes. I would rather had the original data.
The figure itself is made from a singular value decomposition of the data from Fig.2A of the article. The 2 largest dimensions, are shown. That is, those 2 eigenvectors with largest eigenvalues, multiplied, making this a pure rotation in 7D space.
The first 5 eigenvalues are:
1. 5302
2. 3971
3. 3770
4. 2582
5. 1722
So only the 3 or 4 first dimensions contribute significantly.
 http://www.ncbi.nlm.nih.gov/pmc/articles/PMC2735096/

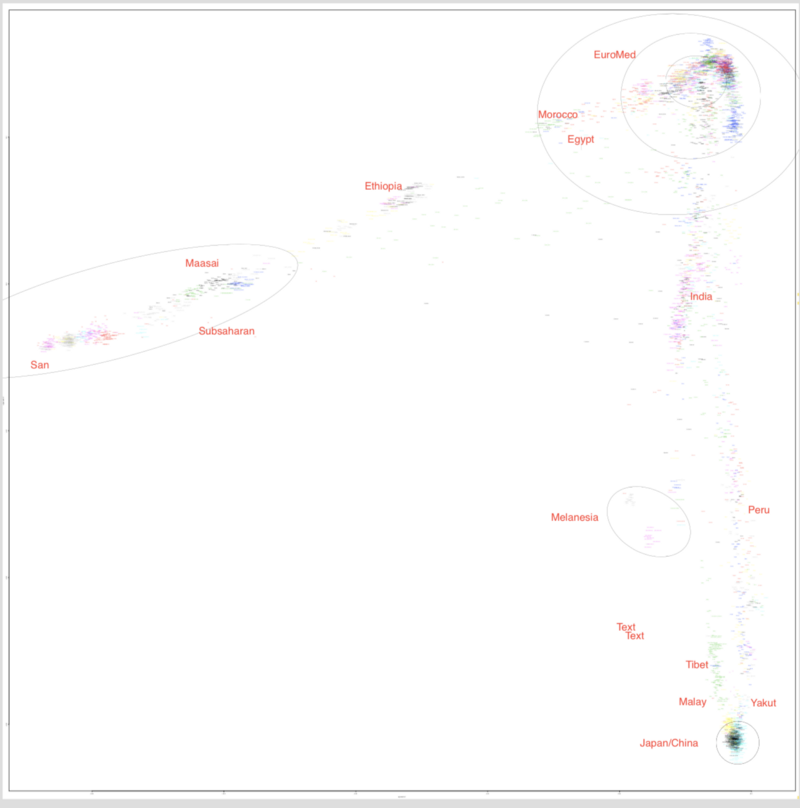
Unfortunately I do not know where it came from. I lost the source.